
BugTrace has three pages and one small menu in the admin bar. This guide shows what you can do on each one.
Only administrators can open the BugTrace pages.
Logs #
Go to BugTrace → Logs. This page shows the errors from your debug log. The newest errors are on the last page.
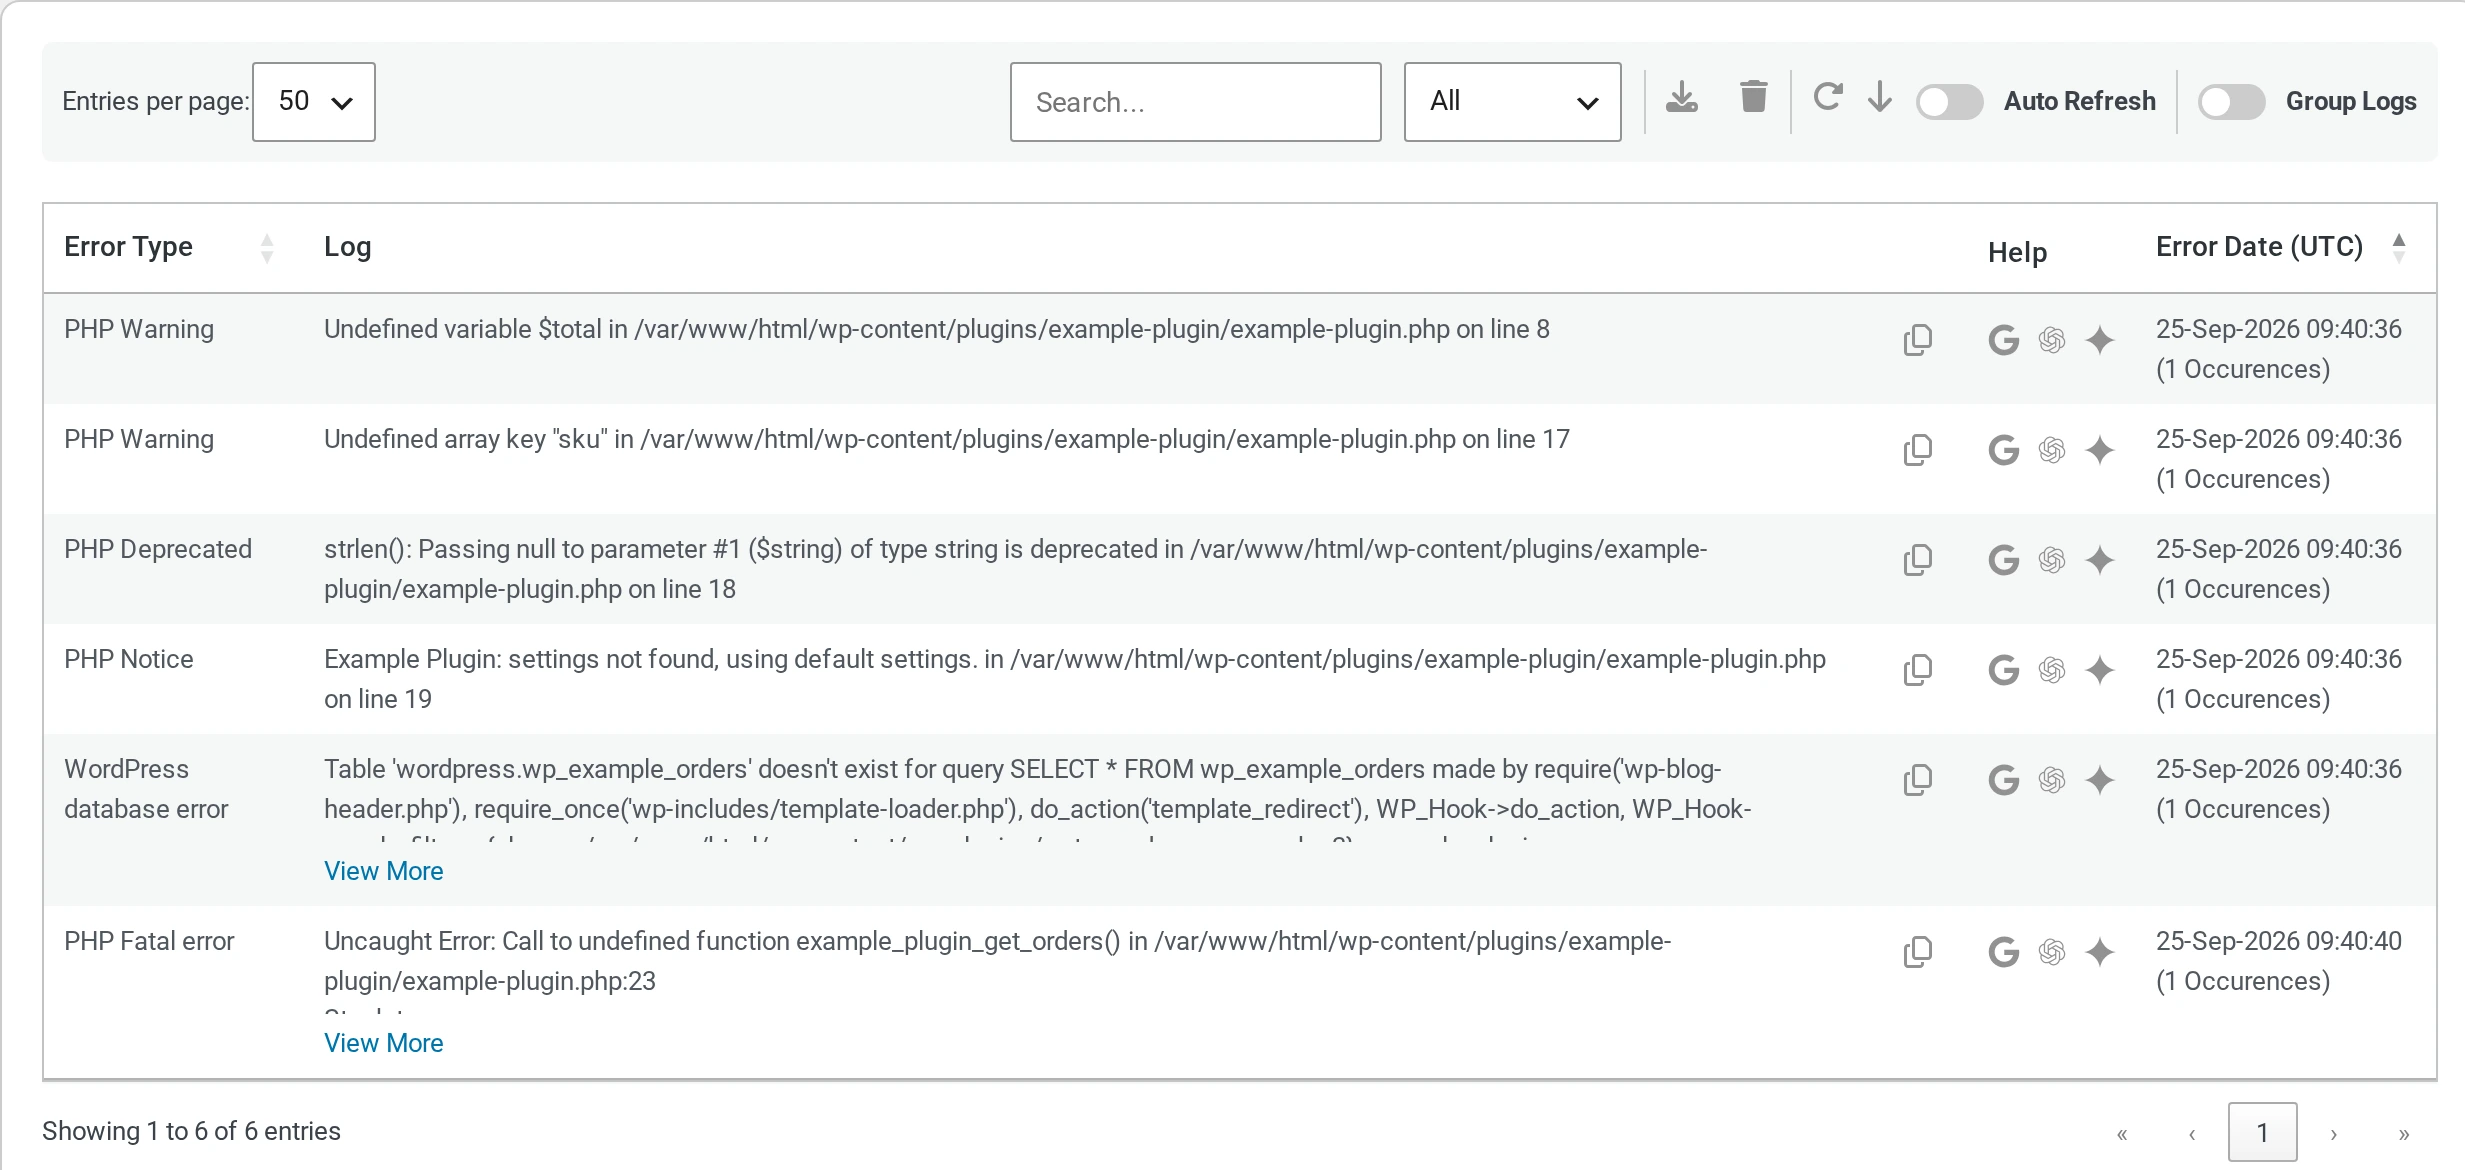
On this page you can:
- Search the log and filter it by error type.
- Group the same error into one line.
- Download or clear the log.
- Copy one error, or search the web for it.
Read more: Read and search your debug log.
Server Info #
Go to BugTrace → Server Info. This page shows facts about your site and server in seven tabs: WP Config, HTACCESS, PHP Info, Database, Cookies, Transients and Cron Jobs.
You can only look at this information. BugTrace does not change anything on this page.
Read more: Check your server info.
Settings #
Go to BugTrace → Settings. Here you turn the four WordPress debug settings on or off. You can also choose the time zone for the log.
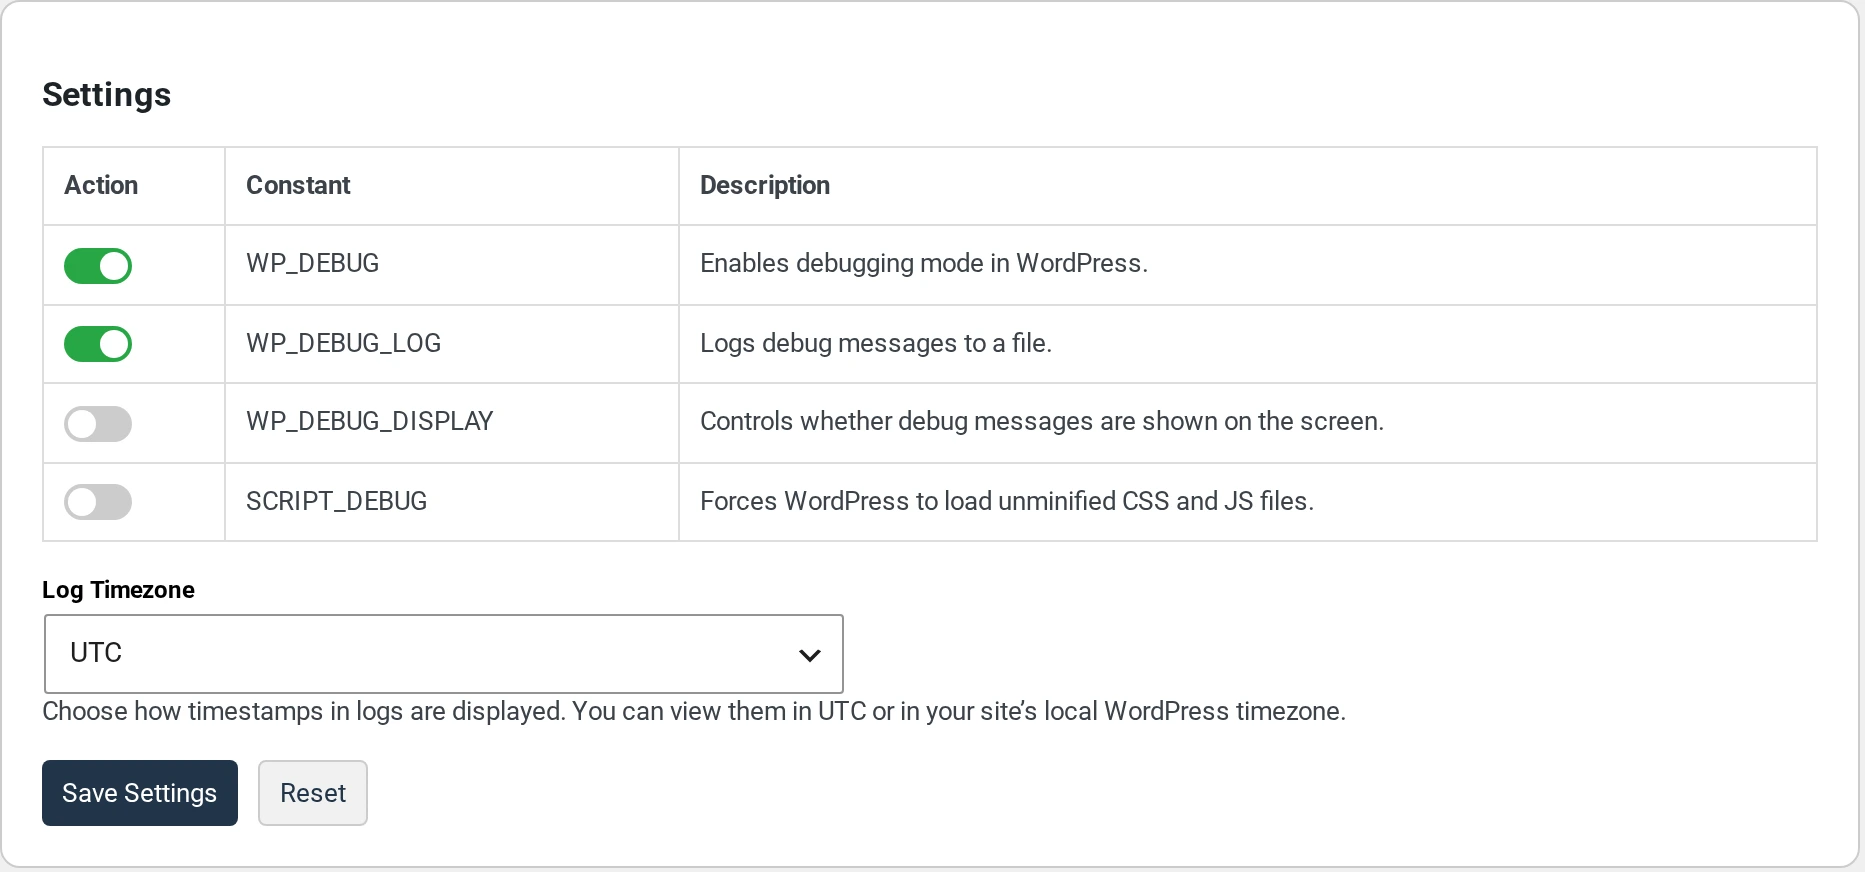
Read more: Turn debug settings on or off.
The admin bar menu #
BugTrace also adds a BugTrace menu to the admin bar at the top of the screen. It has three links:
- View Log opens the Logs page.
- Download Log downloads your
debug.logfile. - Clear Log empties your log.
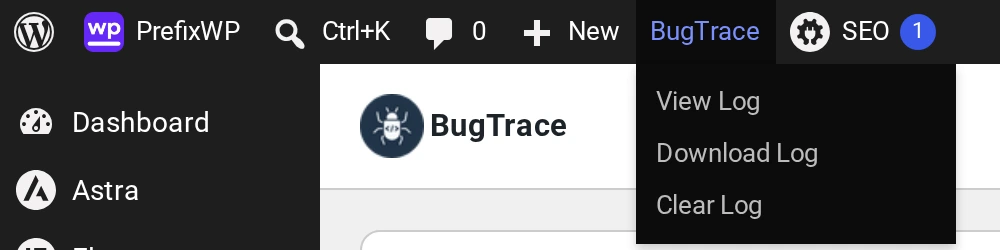
Clear Log in the admin bar empties the log at once. It does not ask you first. You cannot undo it.
Support and reviews #
At the top of every BugTrace page there are two buttons:
- Support opens the BugTrace forum on WordPress.org.
- Add a Review lets you rate BugTrace on WordPress.org.
BugTrace is 100% free. There is no Pro version and you do not need an account.