
The Pastmark dashboard gives you a quick overview of the activity on your site.
Go to User Activity → Dashboard.
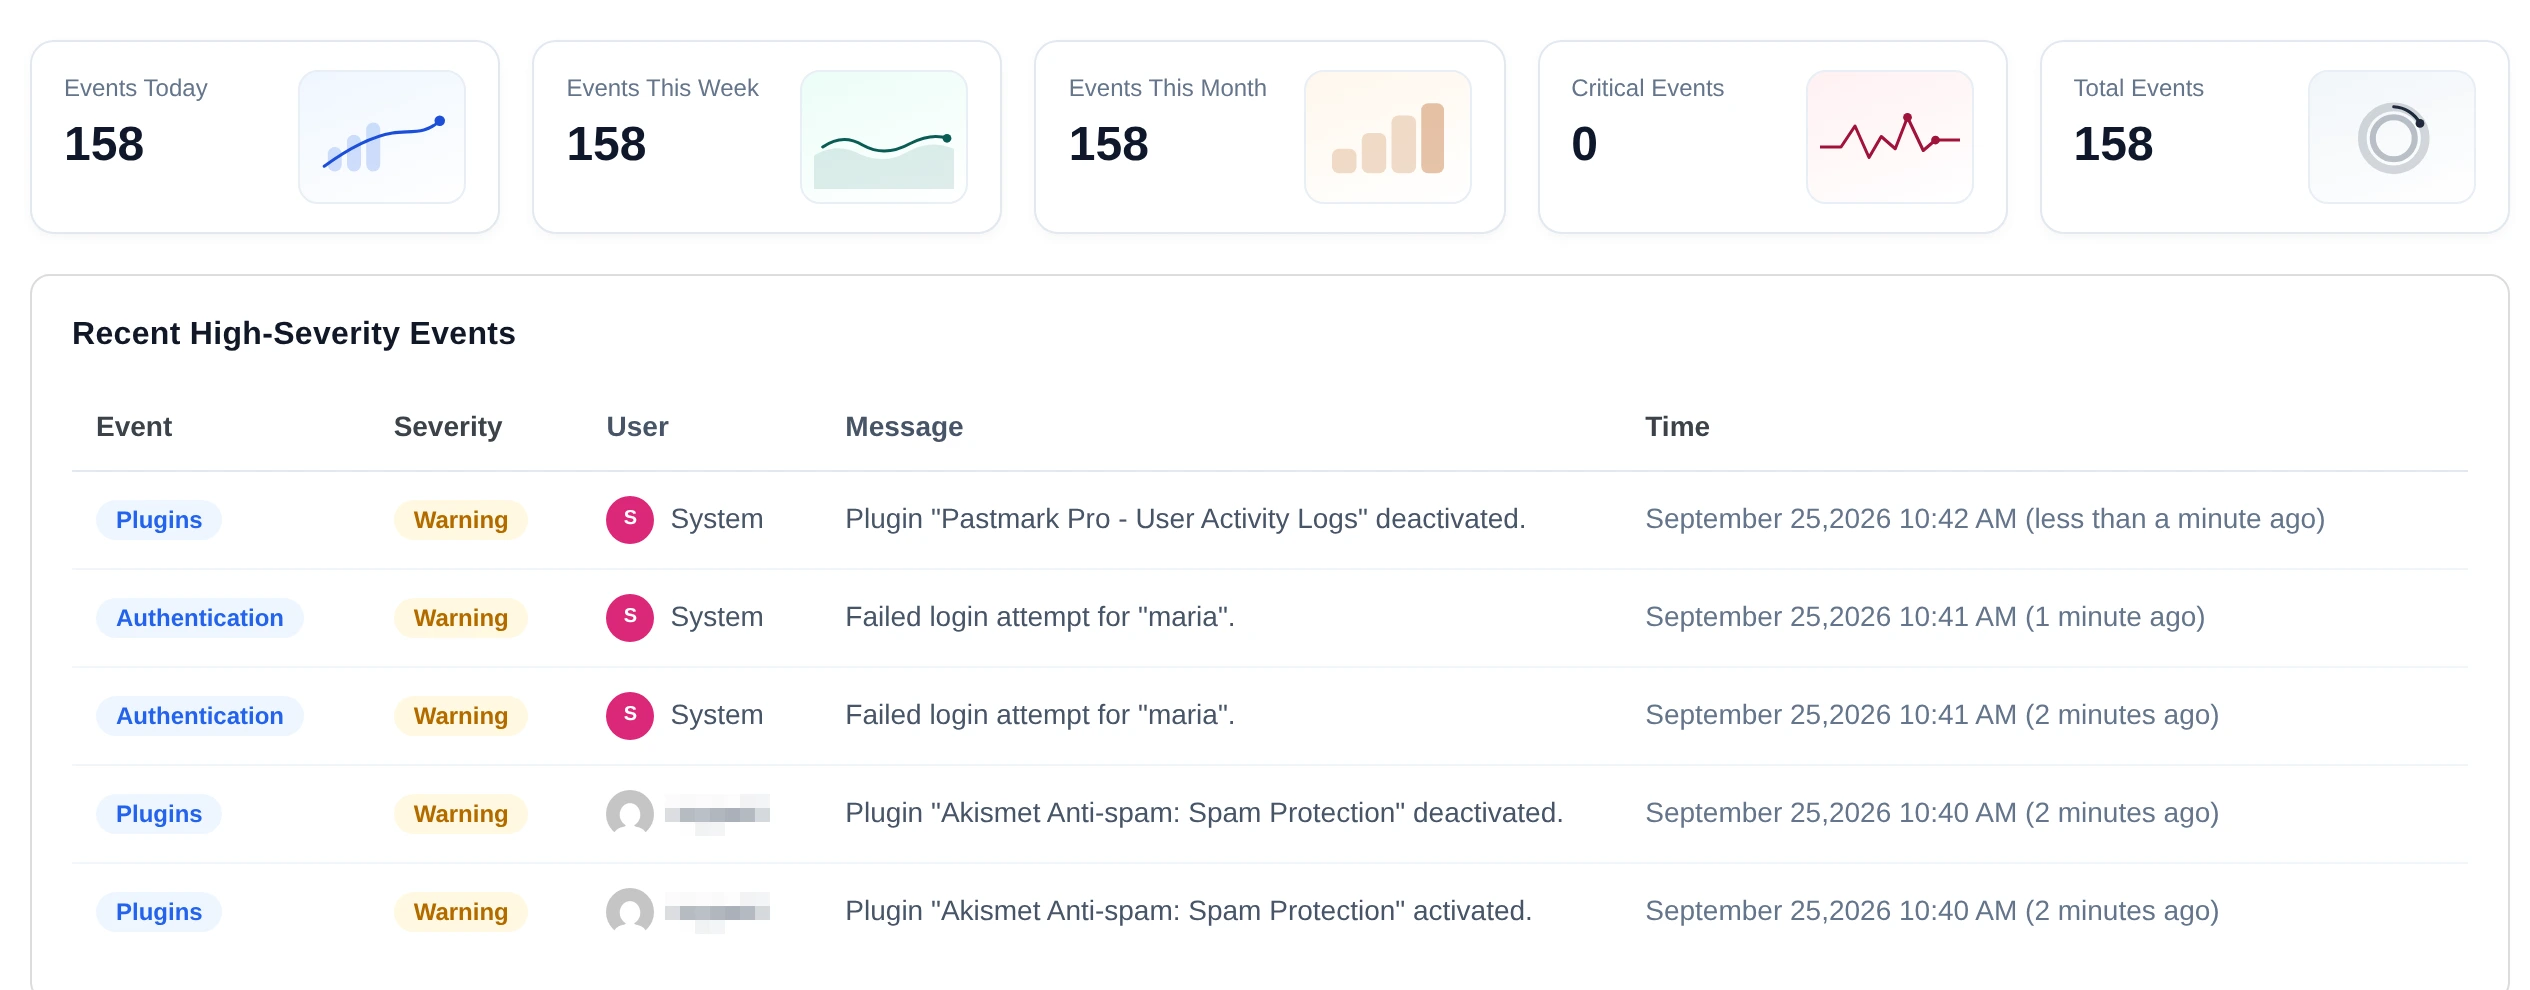
Choose a time range #
At the top, choose Today, Last 7 Days, Last 30 Days or Last 90 Days. Click Refresh to load new data.
The cards #
| Card | What it shows |
|---|---|
| Events Today | Events recorded today. |
| Events This Week | Events recorded this week. |
| Events This Month | Events recorded this month. |
| Critical Events | Events with the severity Critical. |
| Total Events | All events in your log. |
The tables and charts #
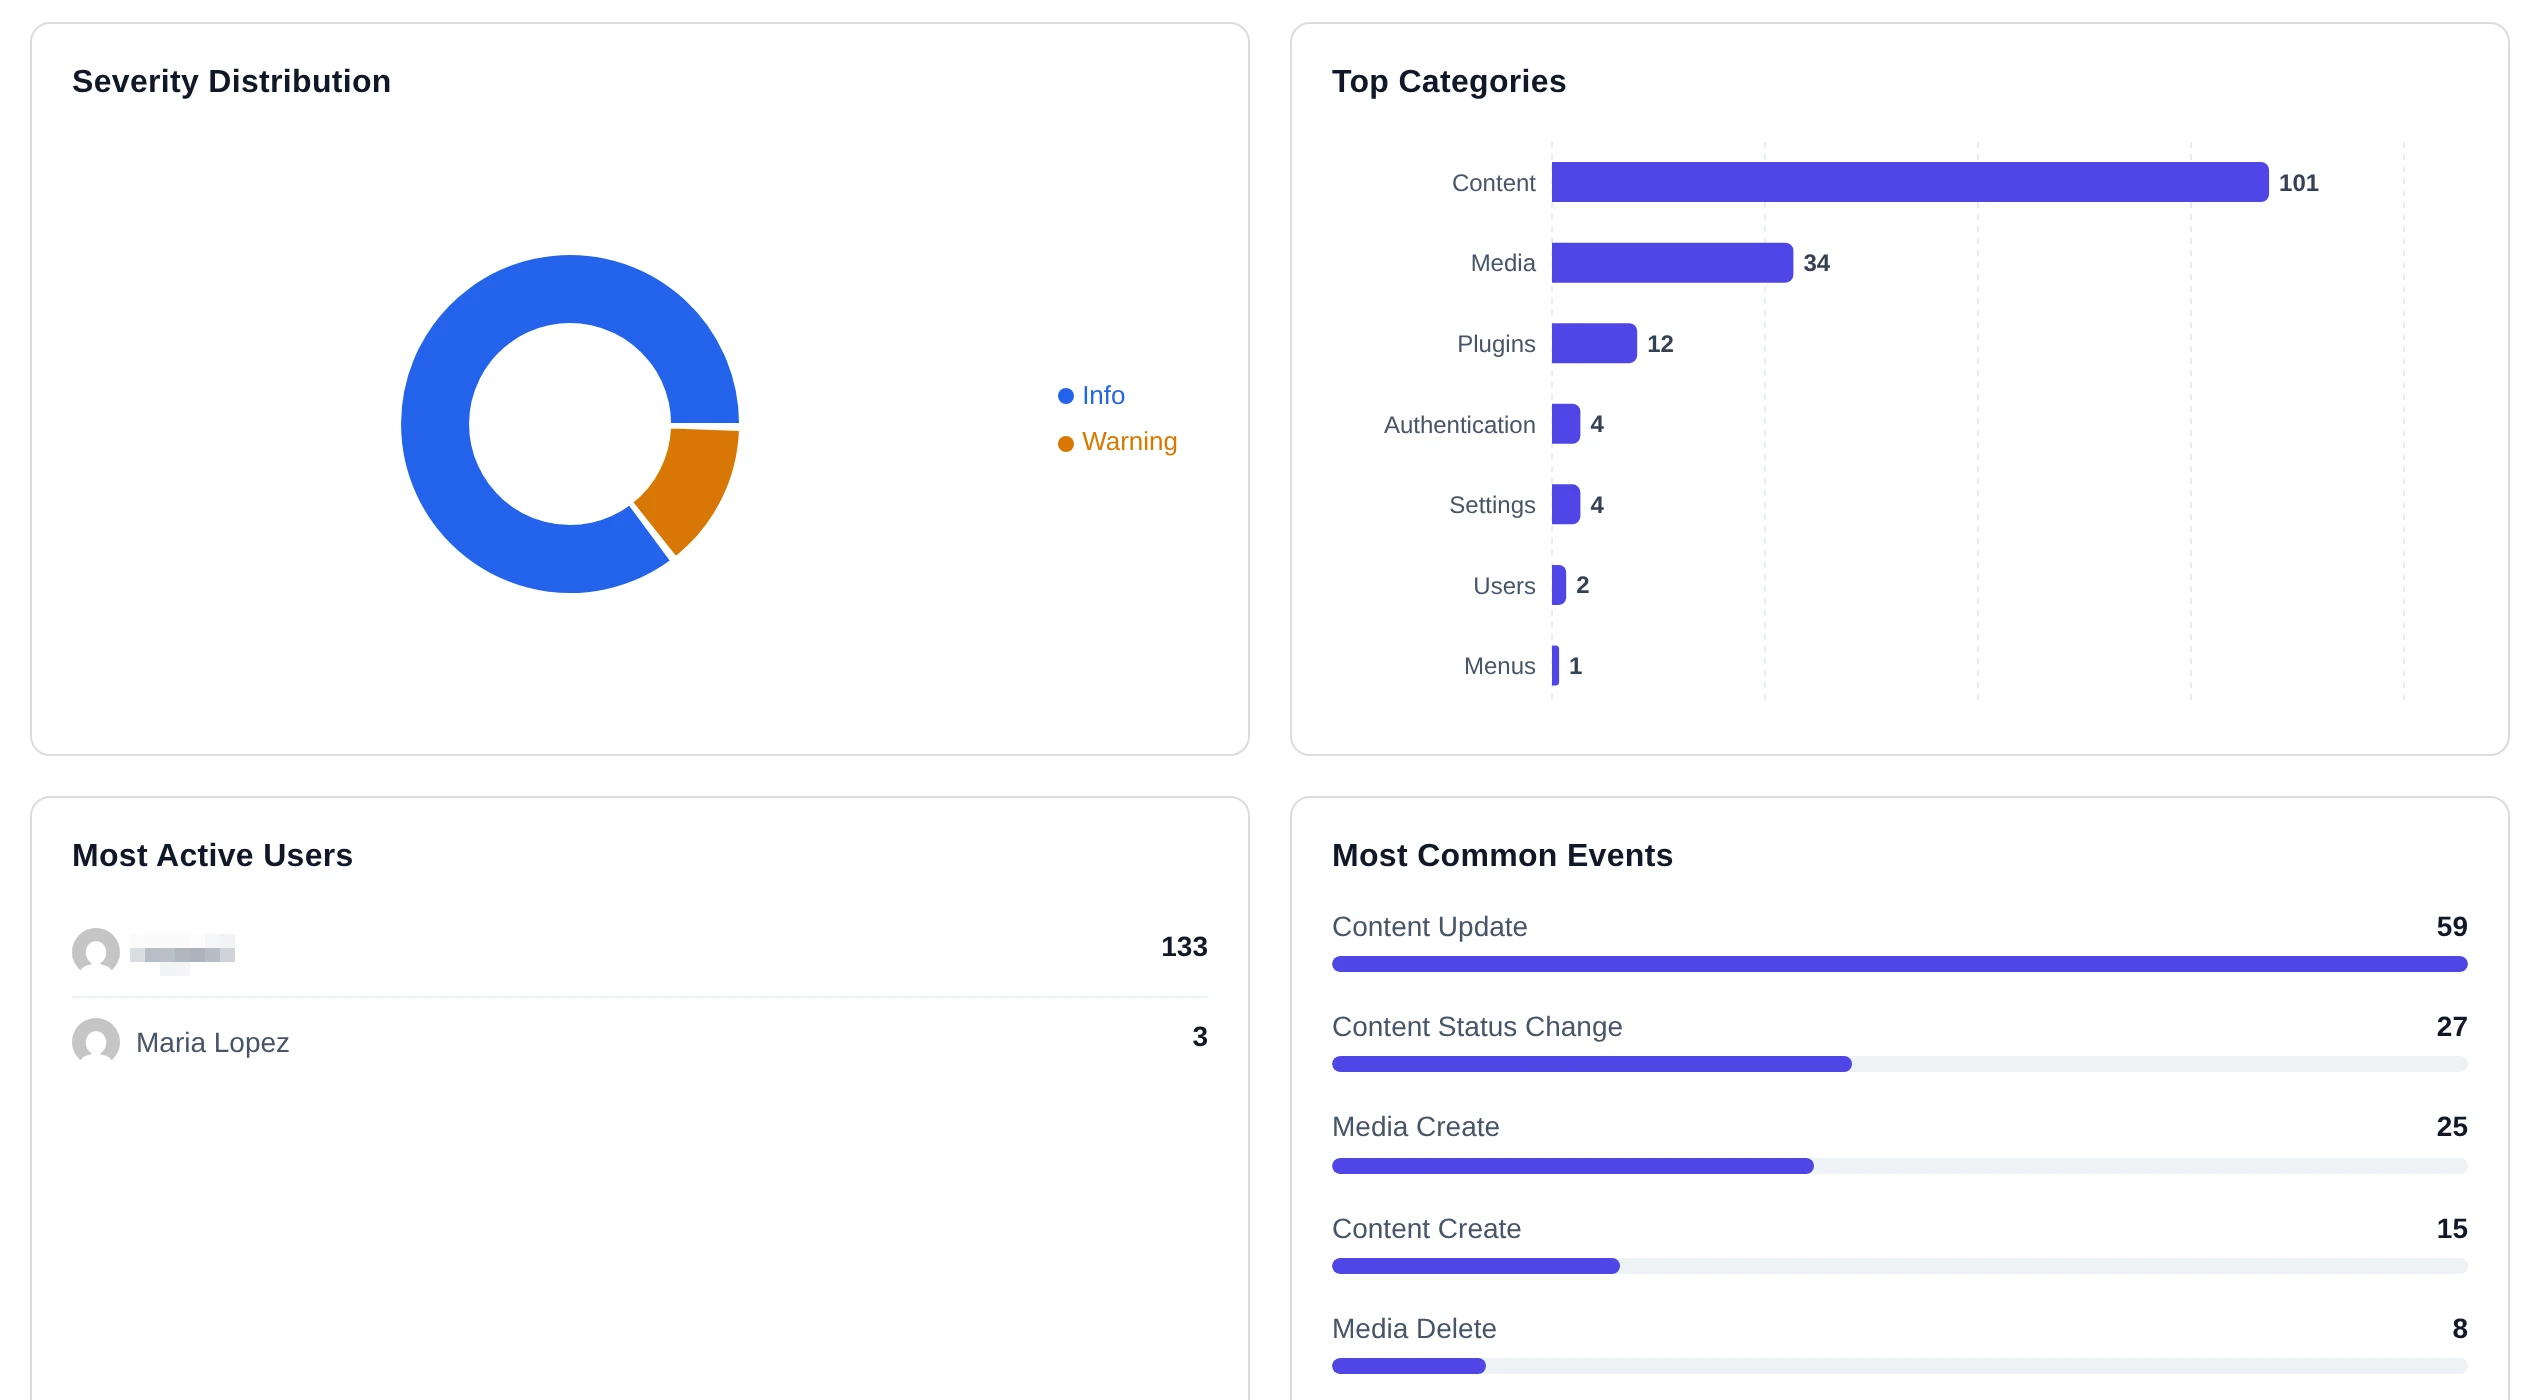
- Recent High-Severity Events lists the latest warnings and errors.
- Activity Timeline shows how many events happened each day.
- Severity Distribution shows how many events have each severity.
- Top Categories shows which kinds of events happen most.
- Most Active Users shows who did the most.
- Most Common Events shows the actions that happen most often.
- Failed Login Attempts lists IP addresses with failed logins. Risk is High at 10 or more attempts, Medium at 5 or more, and Low below 5.
The Latest Activity Logs box #
Pastmark also adds a box to your main WordPress dashboard (Dashboard → Home). It shows the 5 newest events. New events since your last visit have a New label.
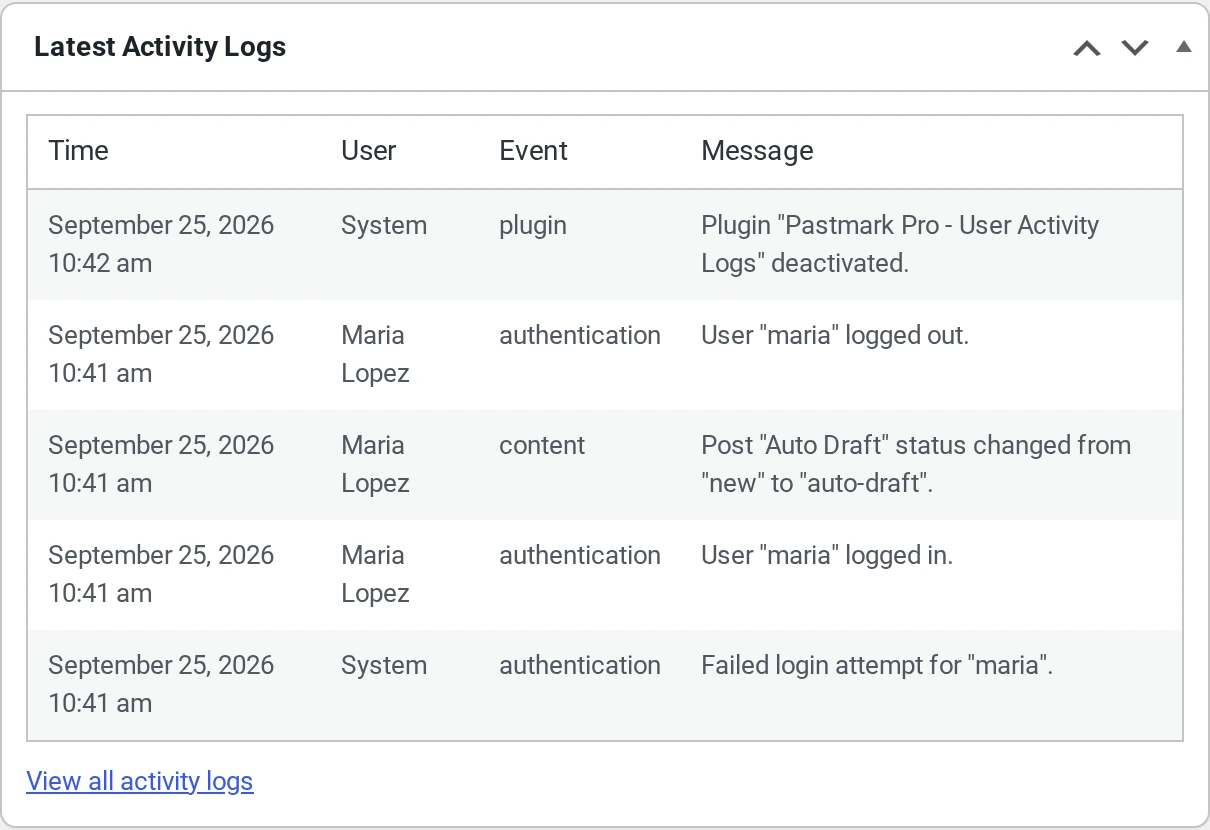
Click View all activity logs to open the full log.
To hide this box, go to User Activity → Settings → General Settings and turn off Dashboard Widget.